
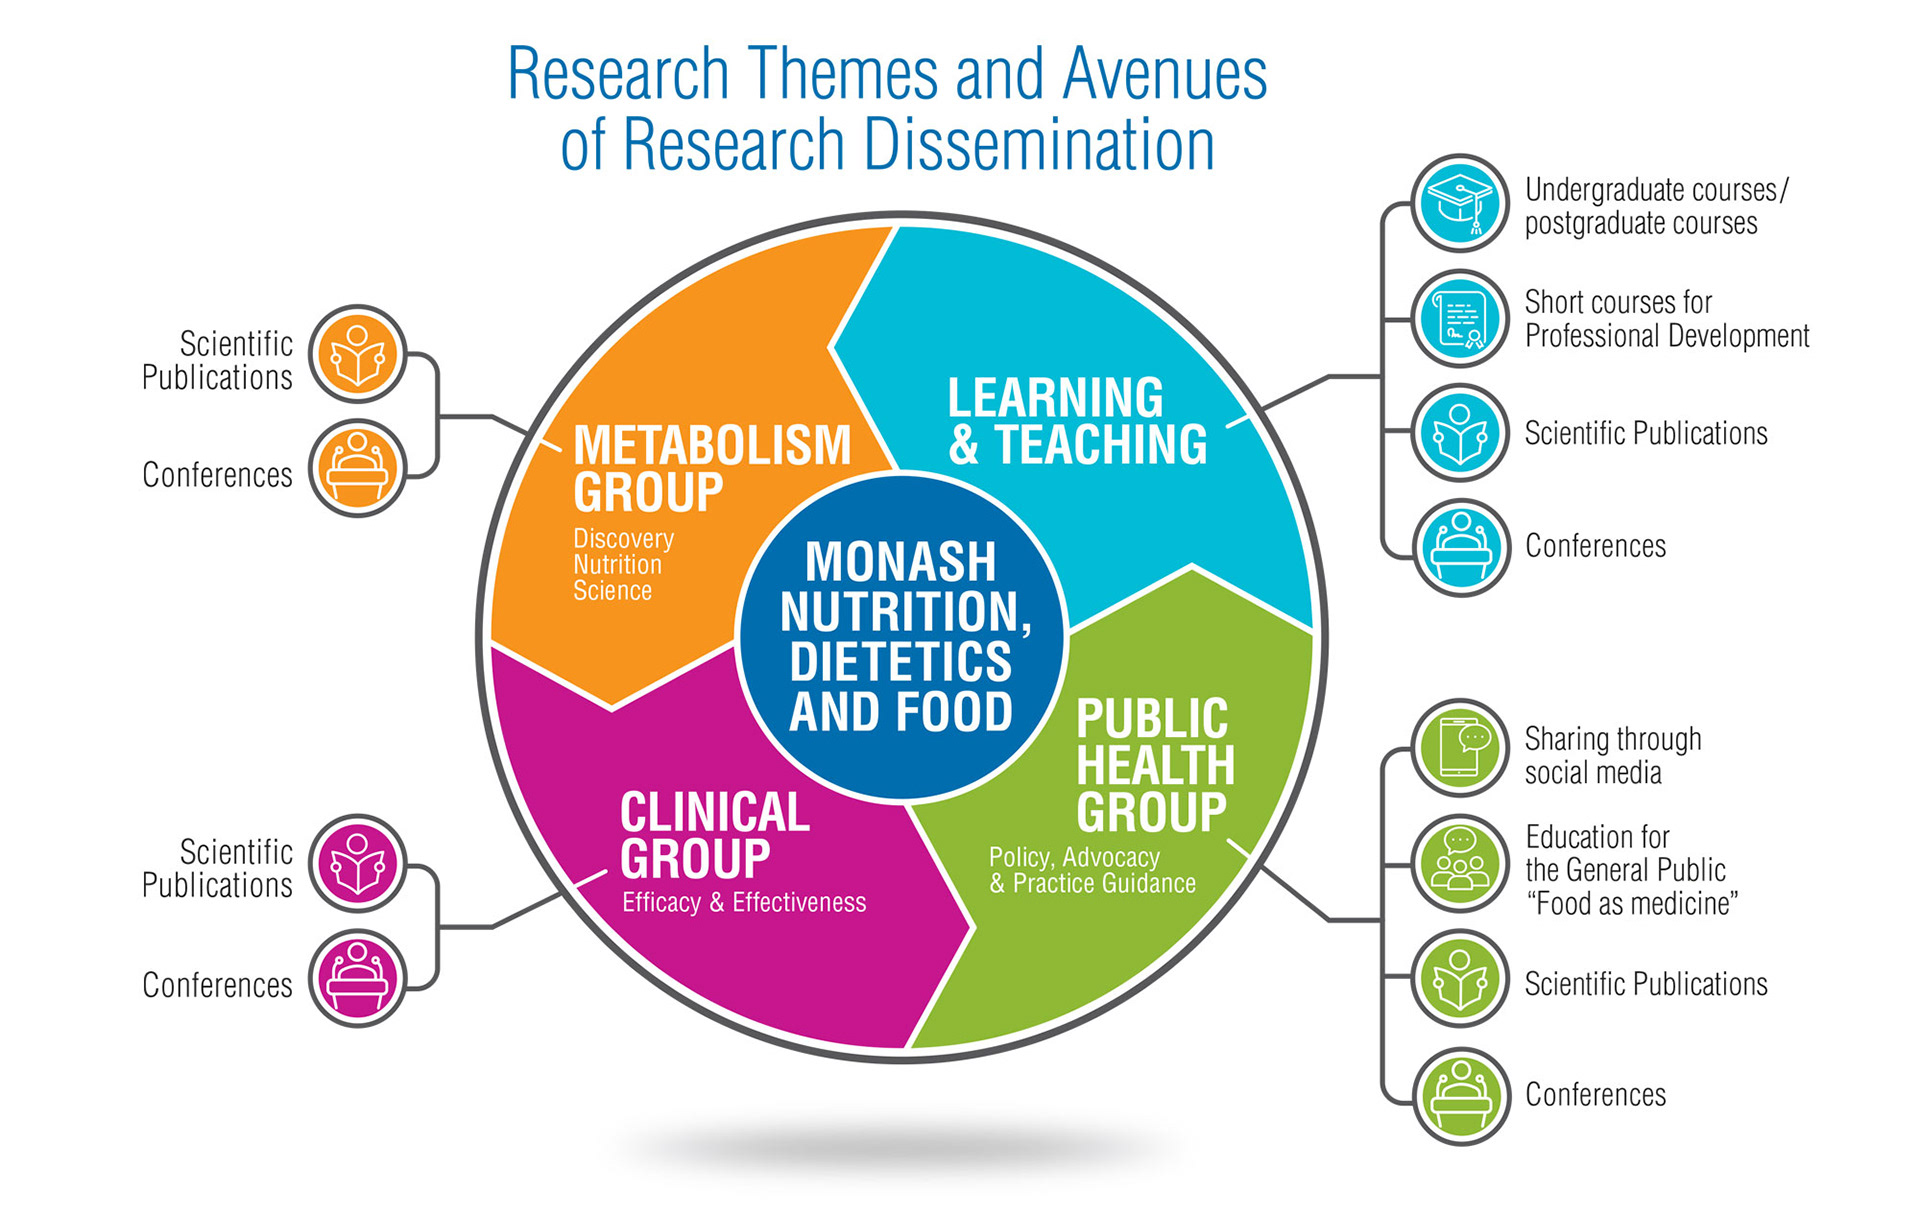
An infographic designed for a client to show their different research themes and the methods by which they distribute that research to different groups. The client supplied source diagram is shown below.
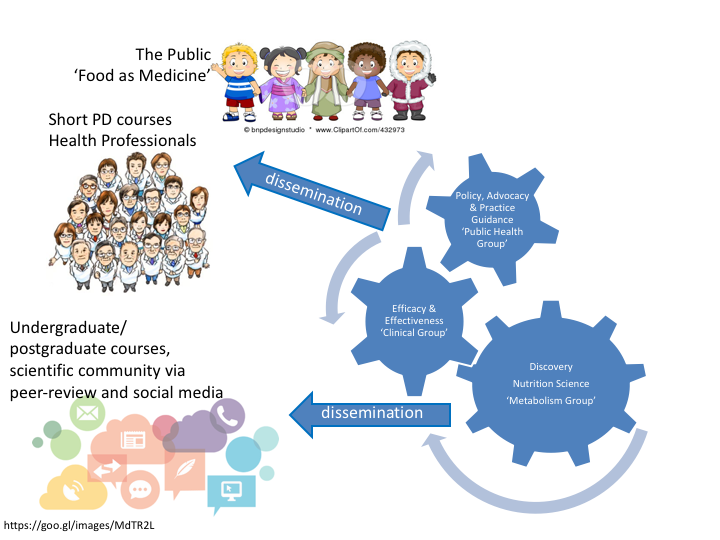

Redesign of a client supplied infographic for Powerpoint presentation. The client supplied source diagram is shown below.
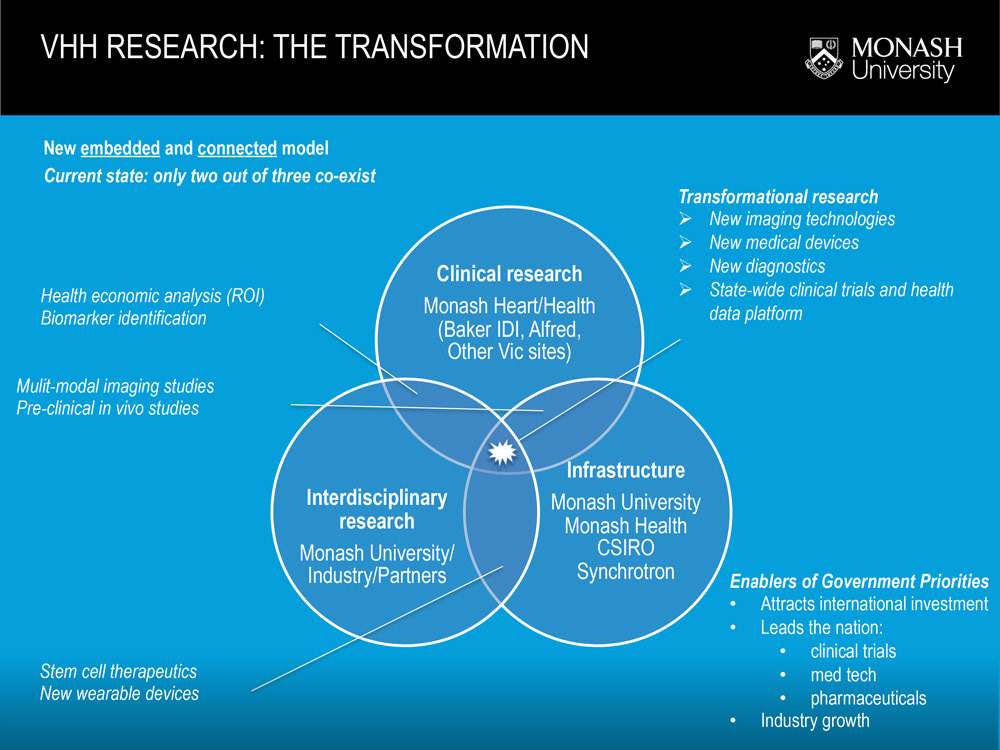

Redesign of a client supplied infographi for Powerpoint presentation. The client supplied source diagram is shown below.


Redesign of a client supplied infographi for Powerpoint presentation. The client supplied source diagram is shown below.

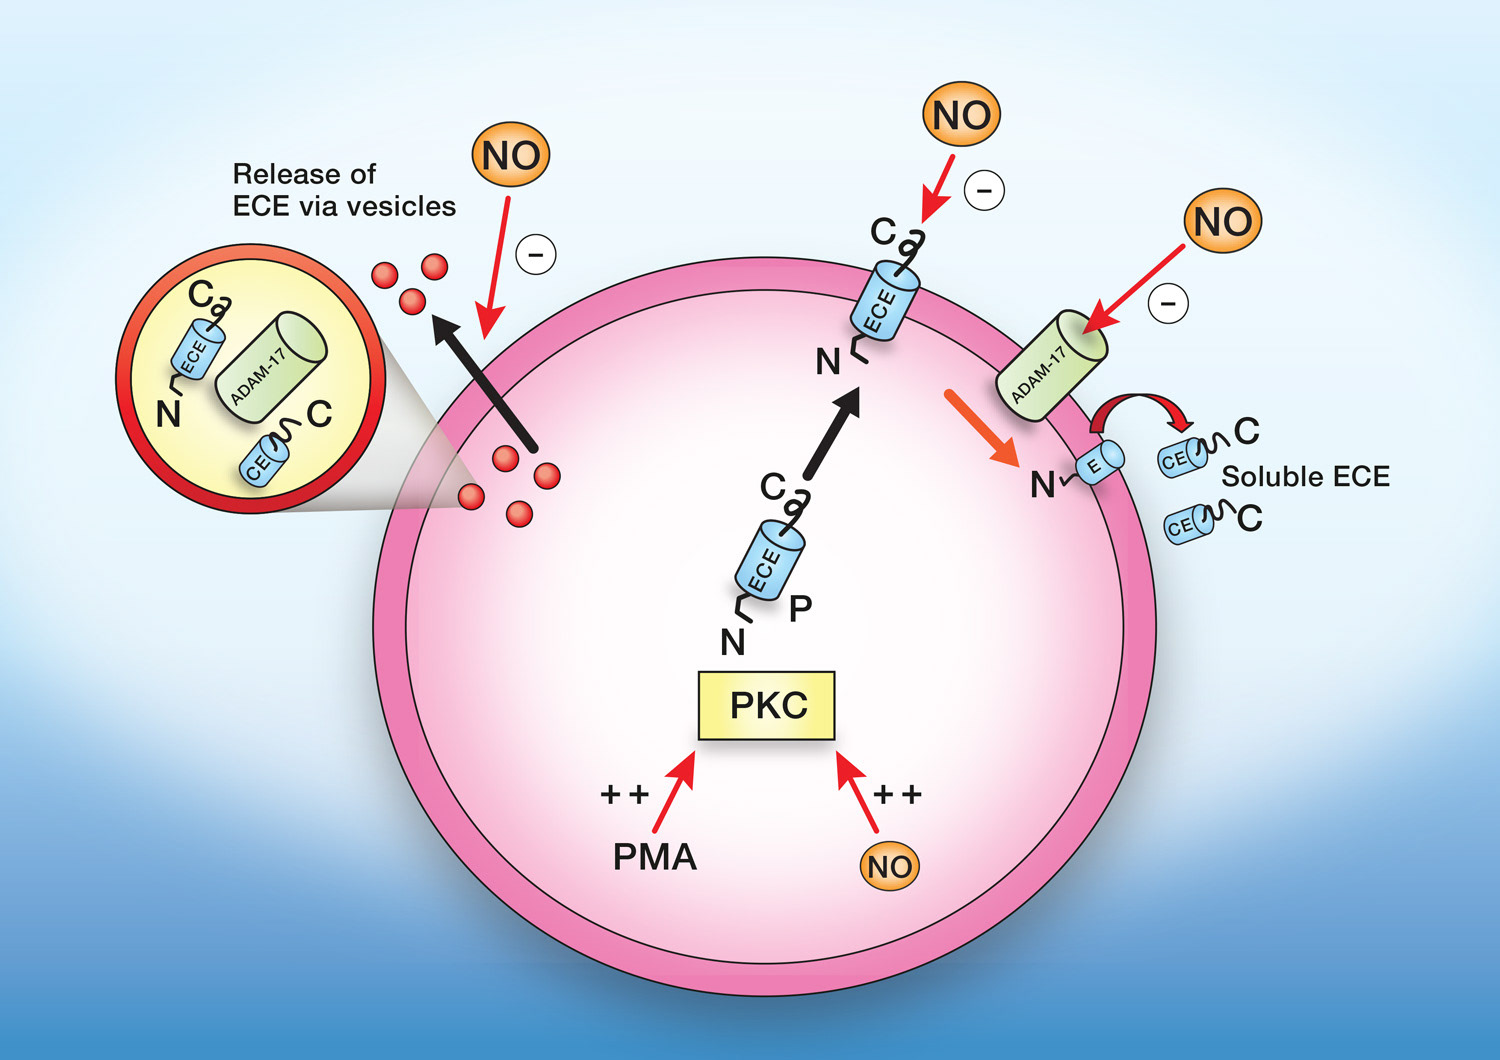
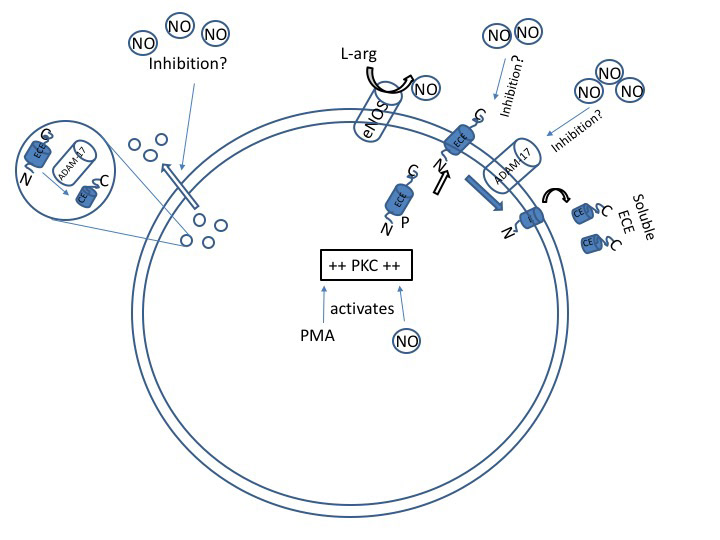
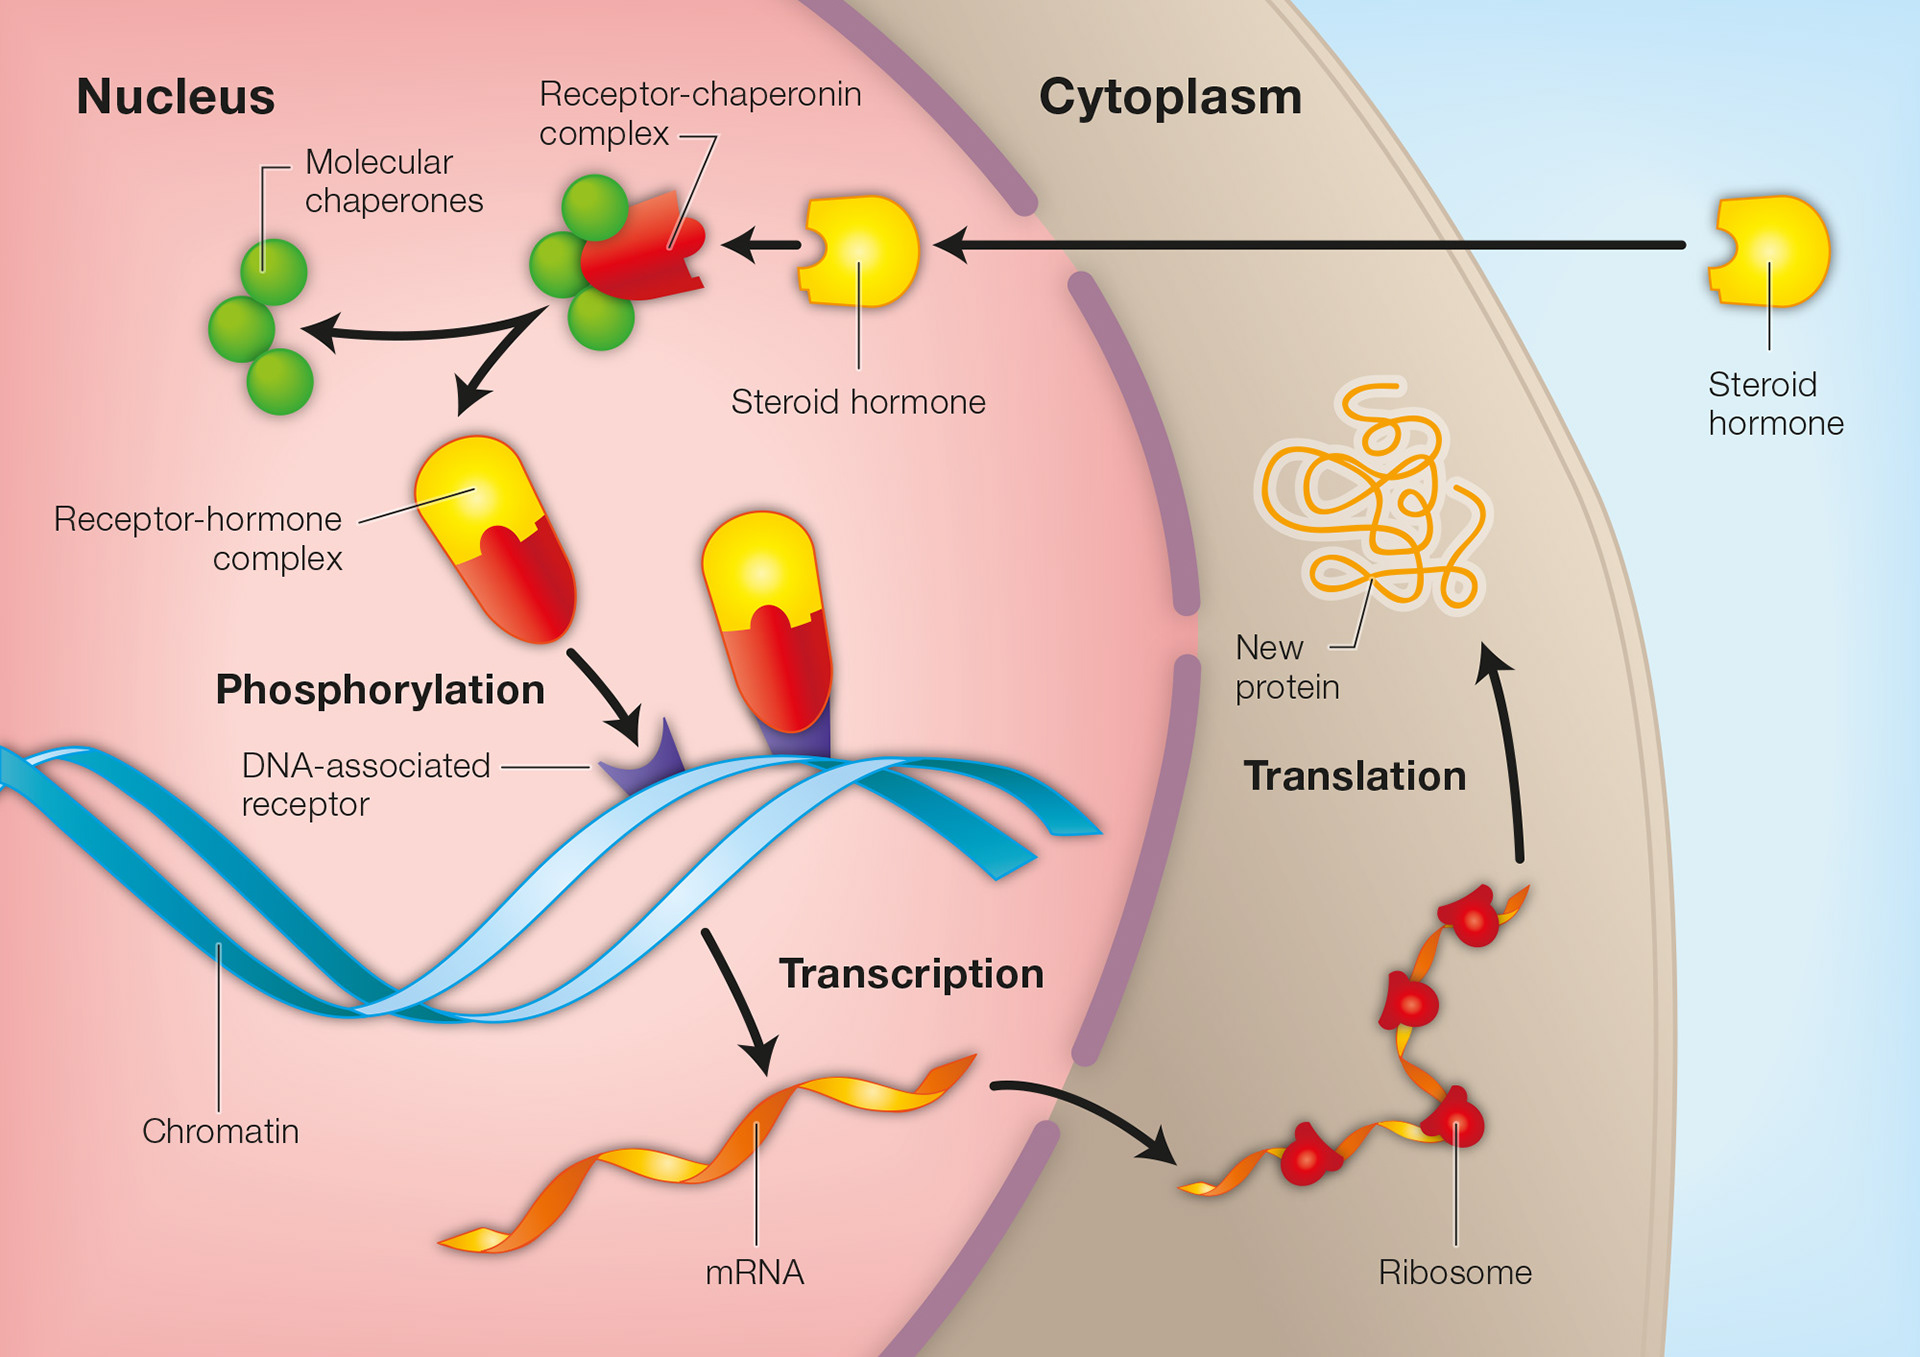
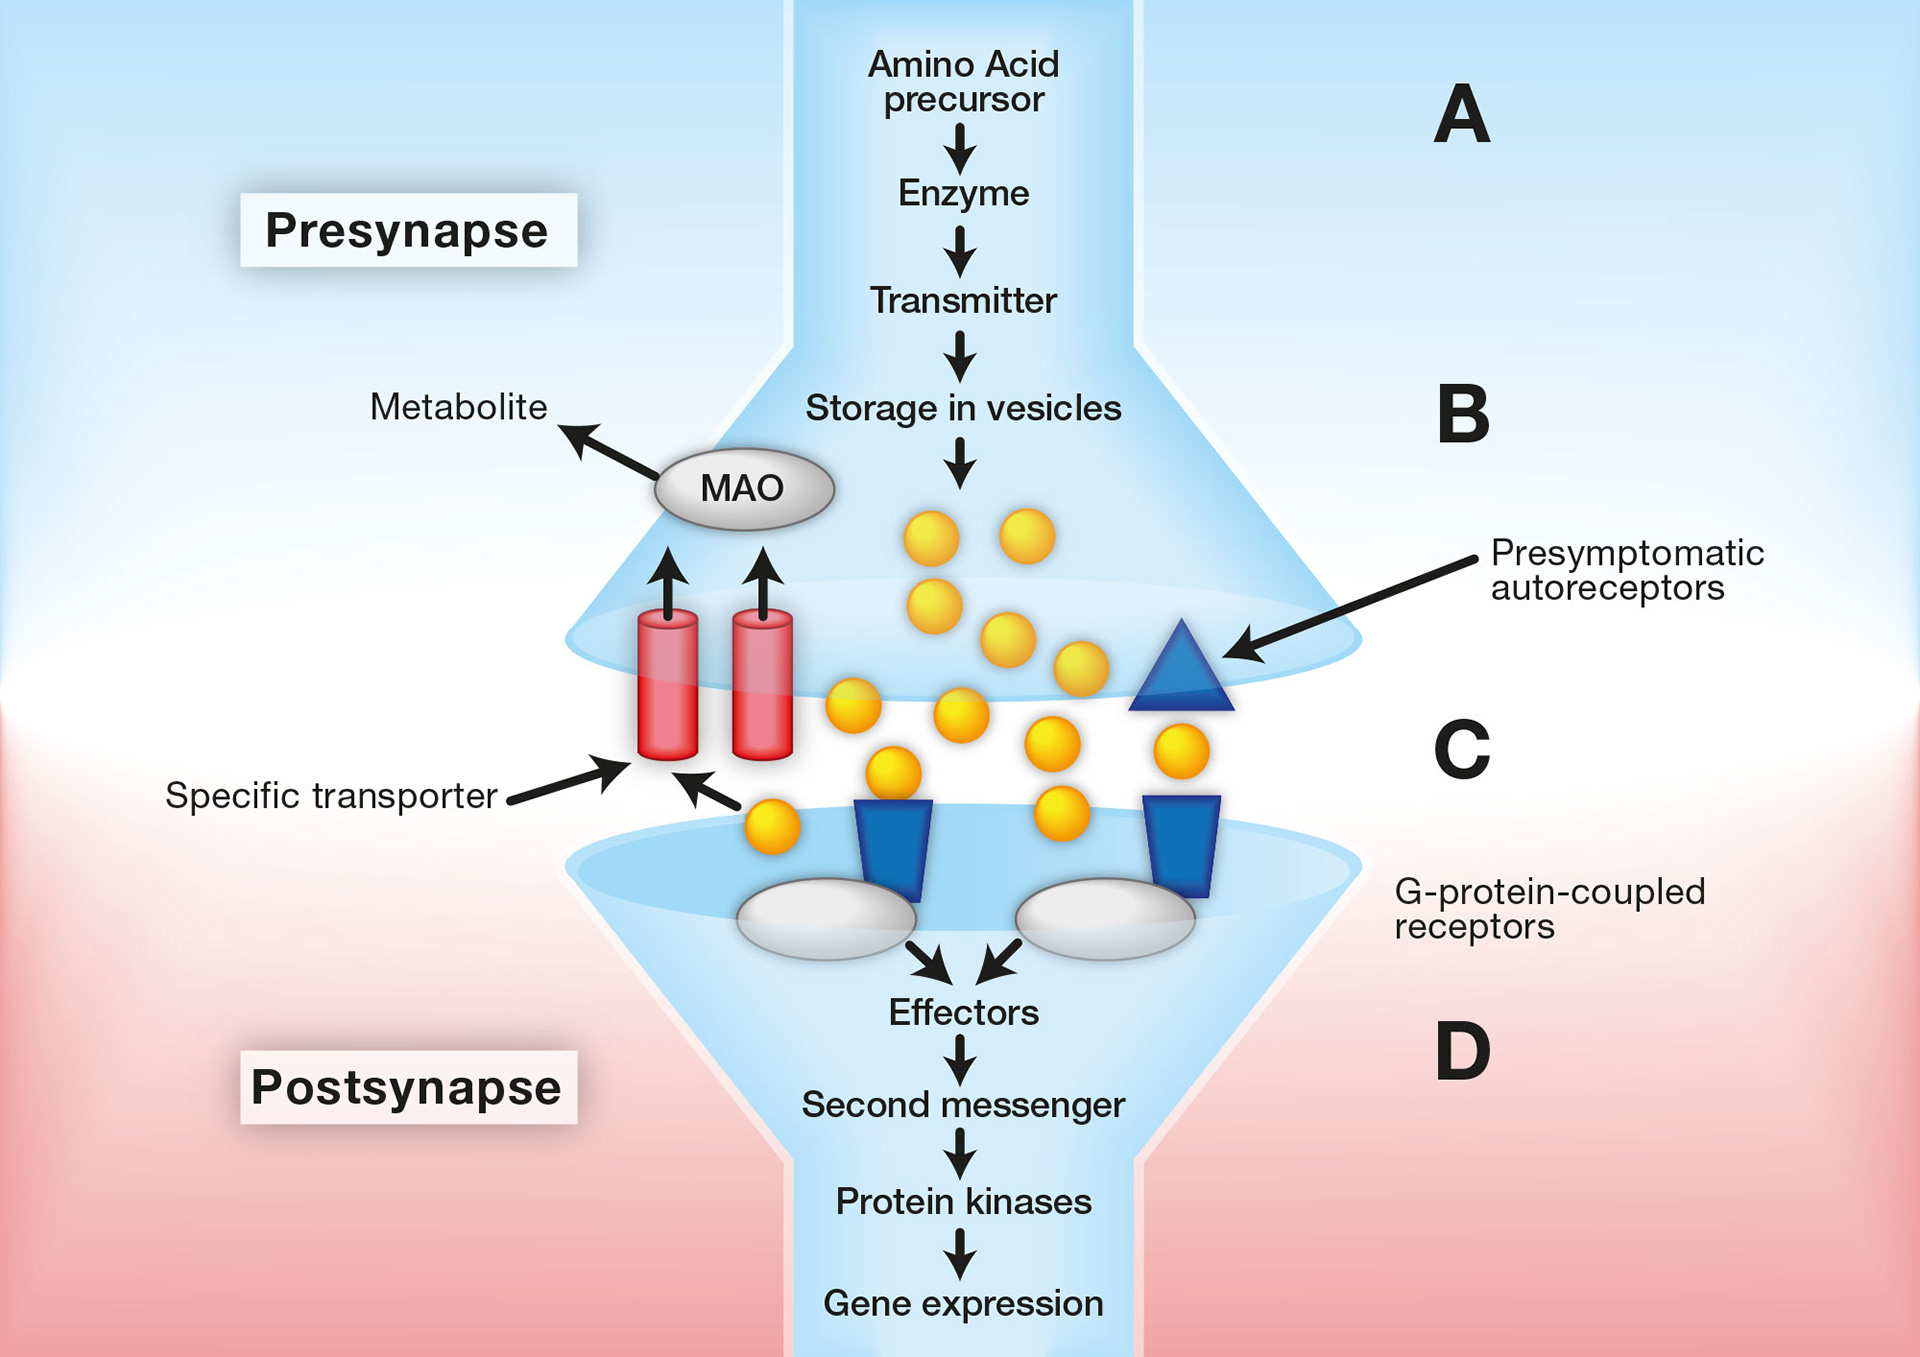
Illustration of biological process developed from initial client-supplied powerpoint document (pictured below)
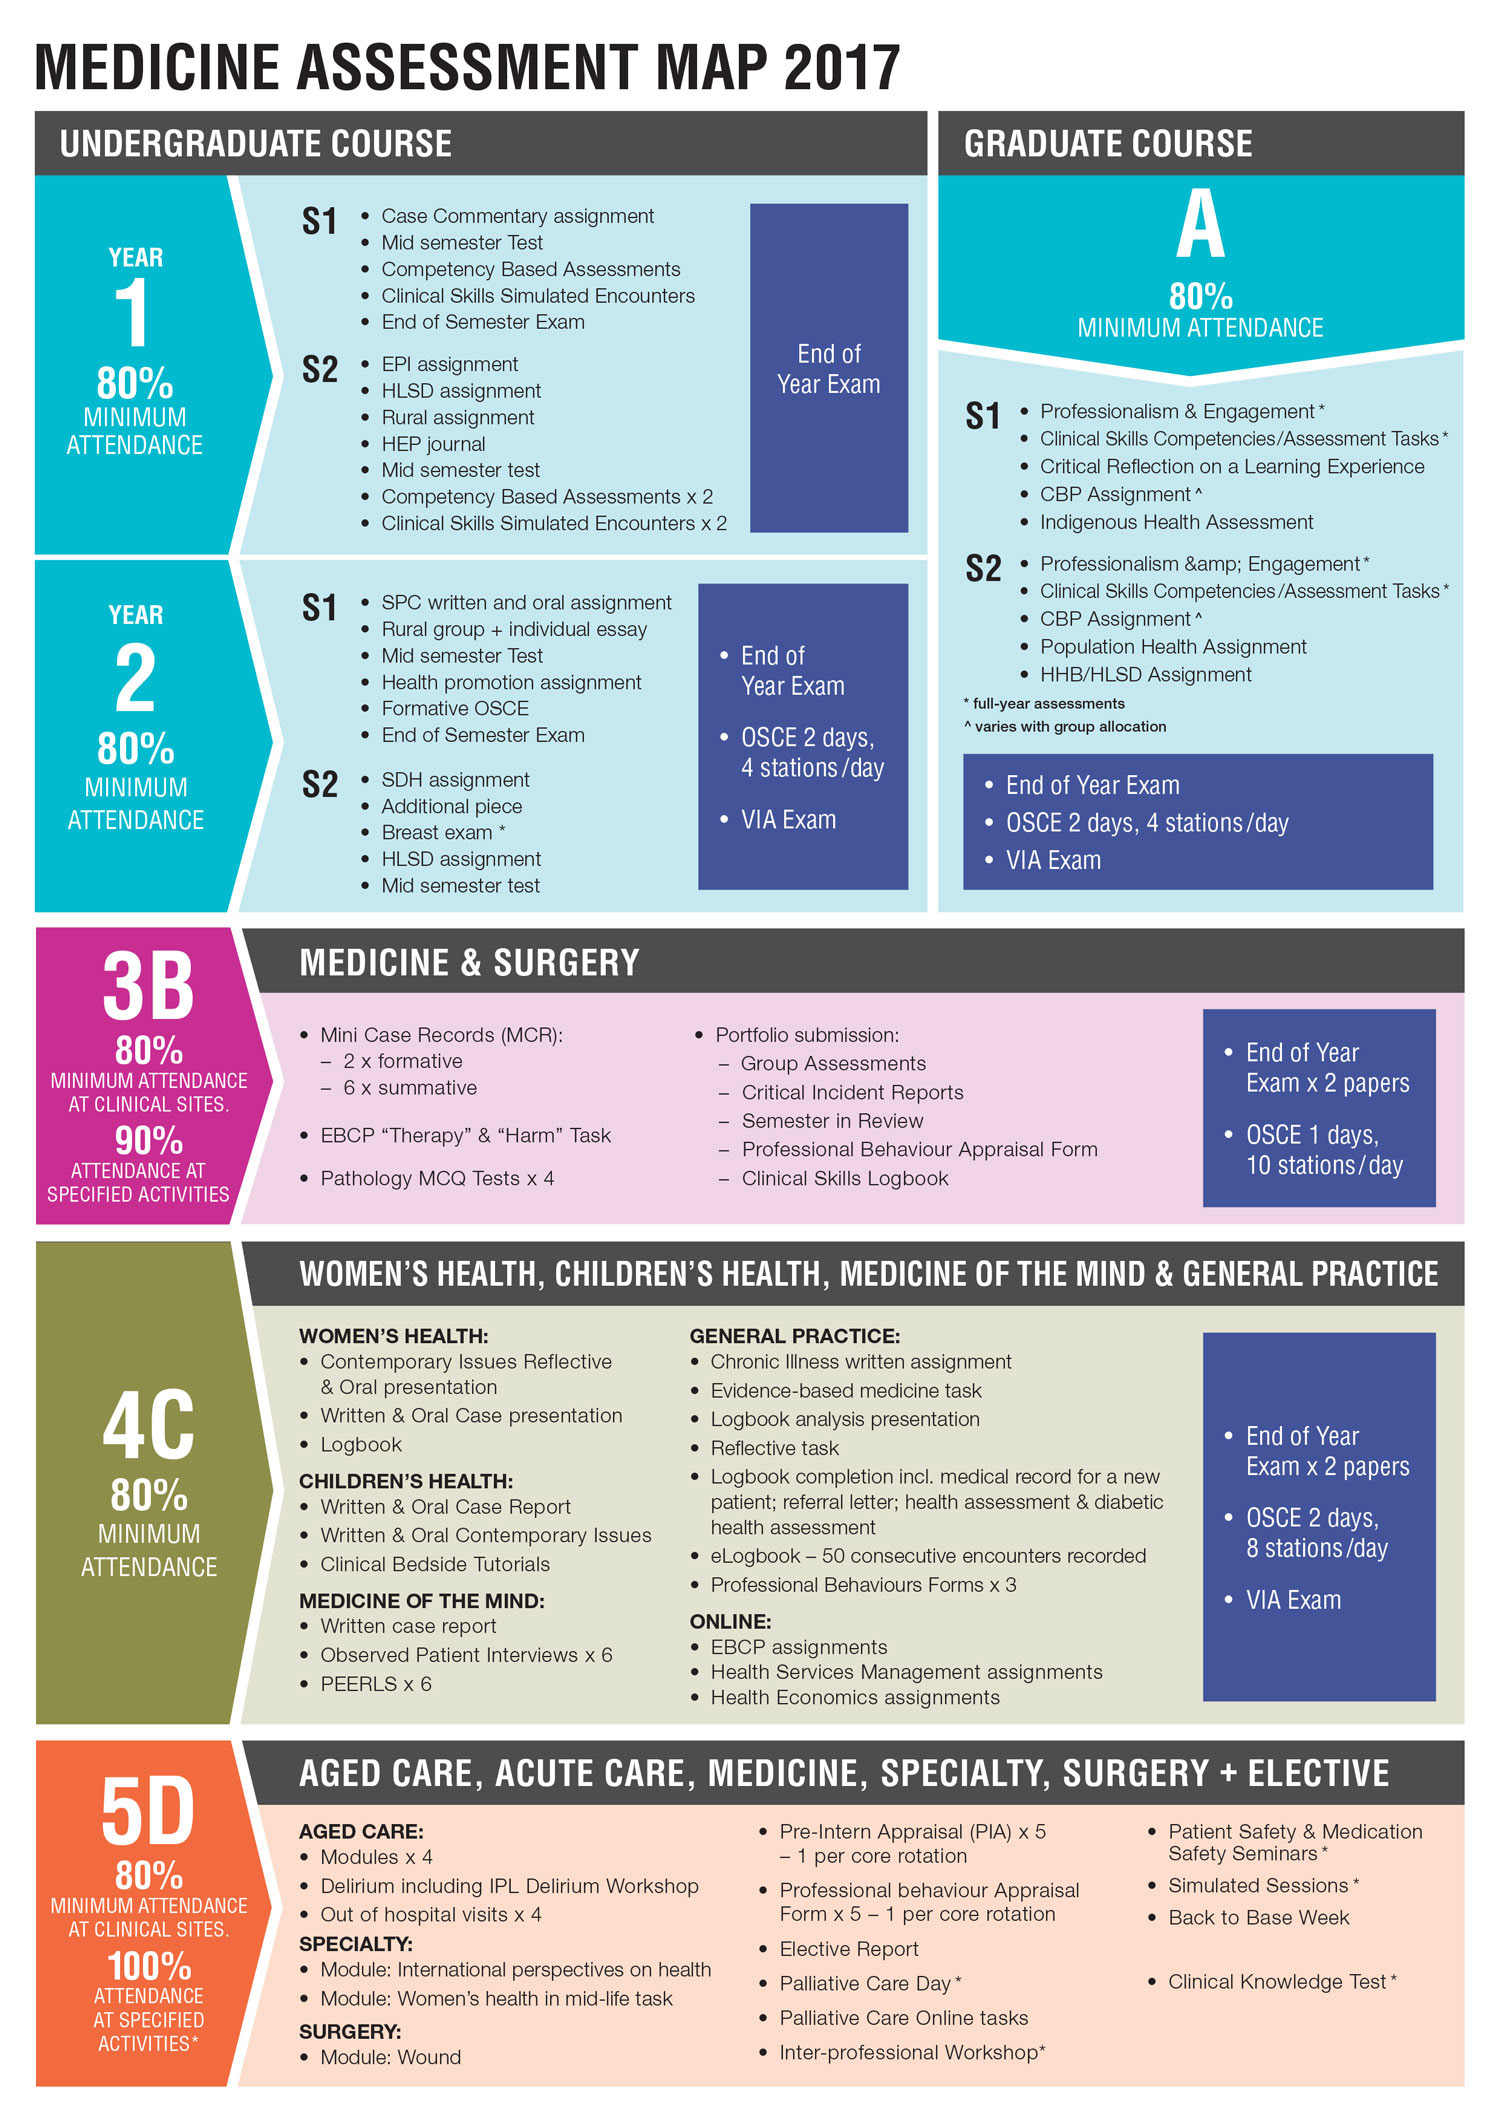
Medicine Assessment Summary Chart.
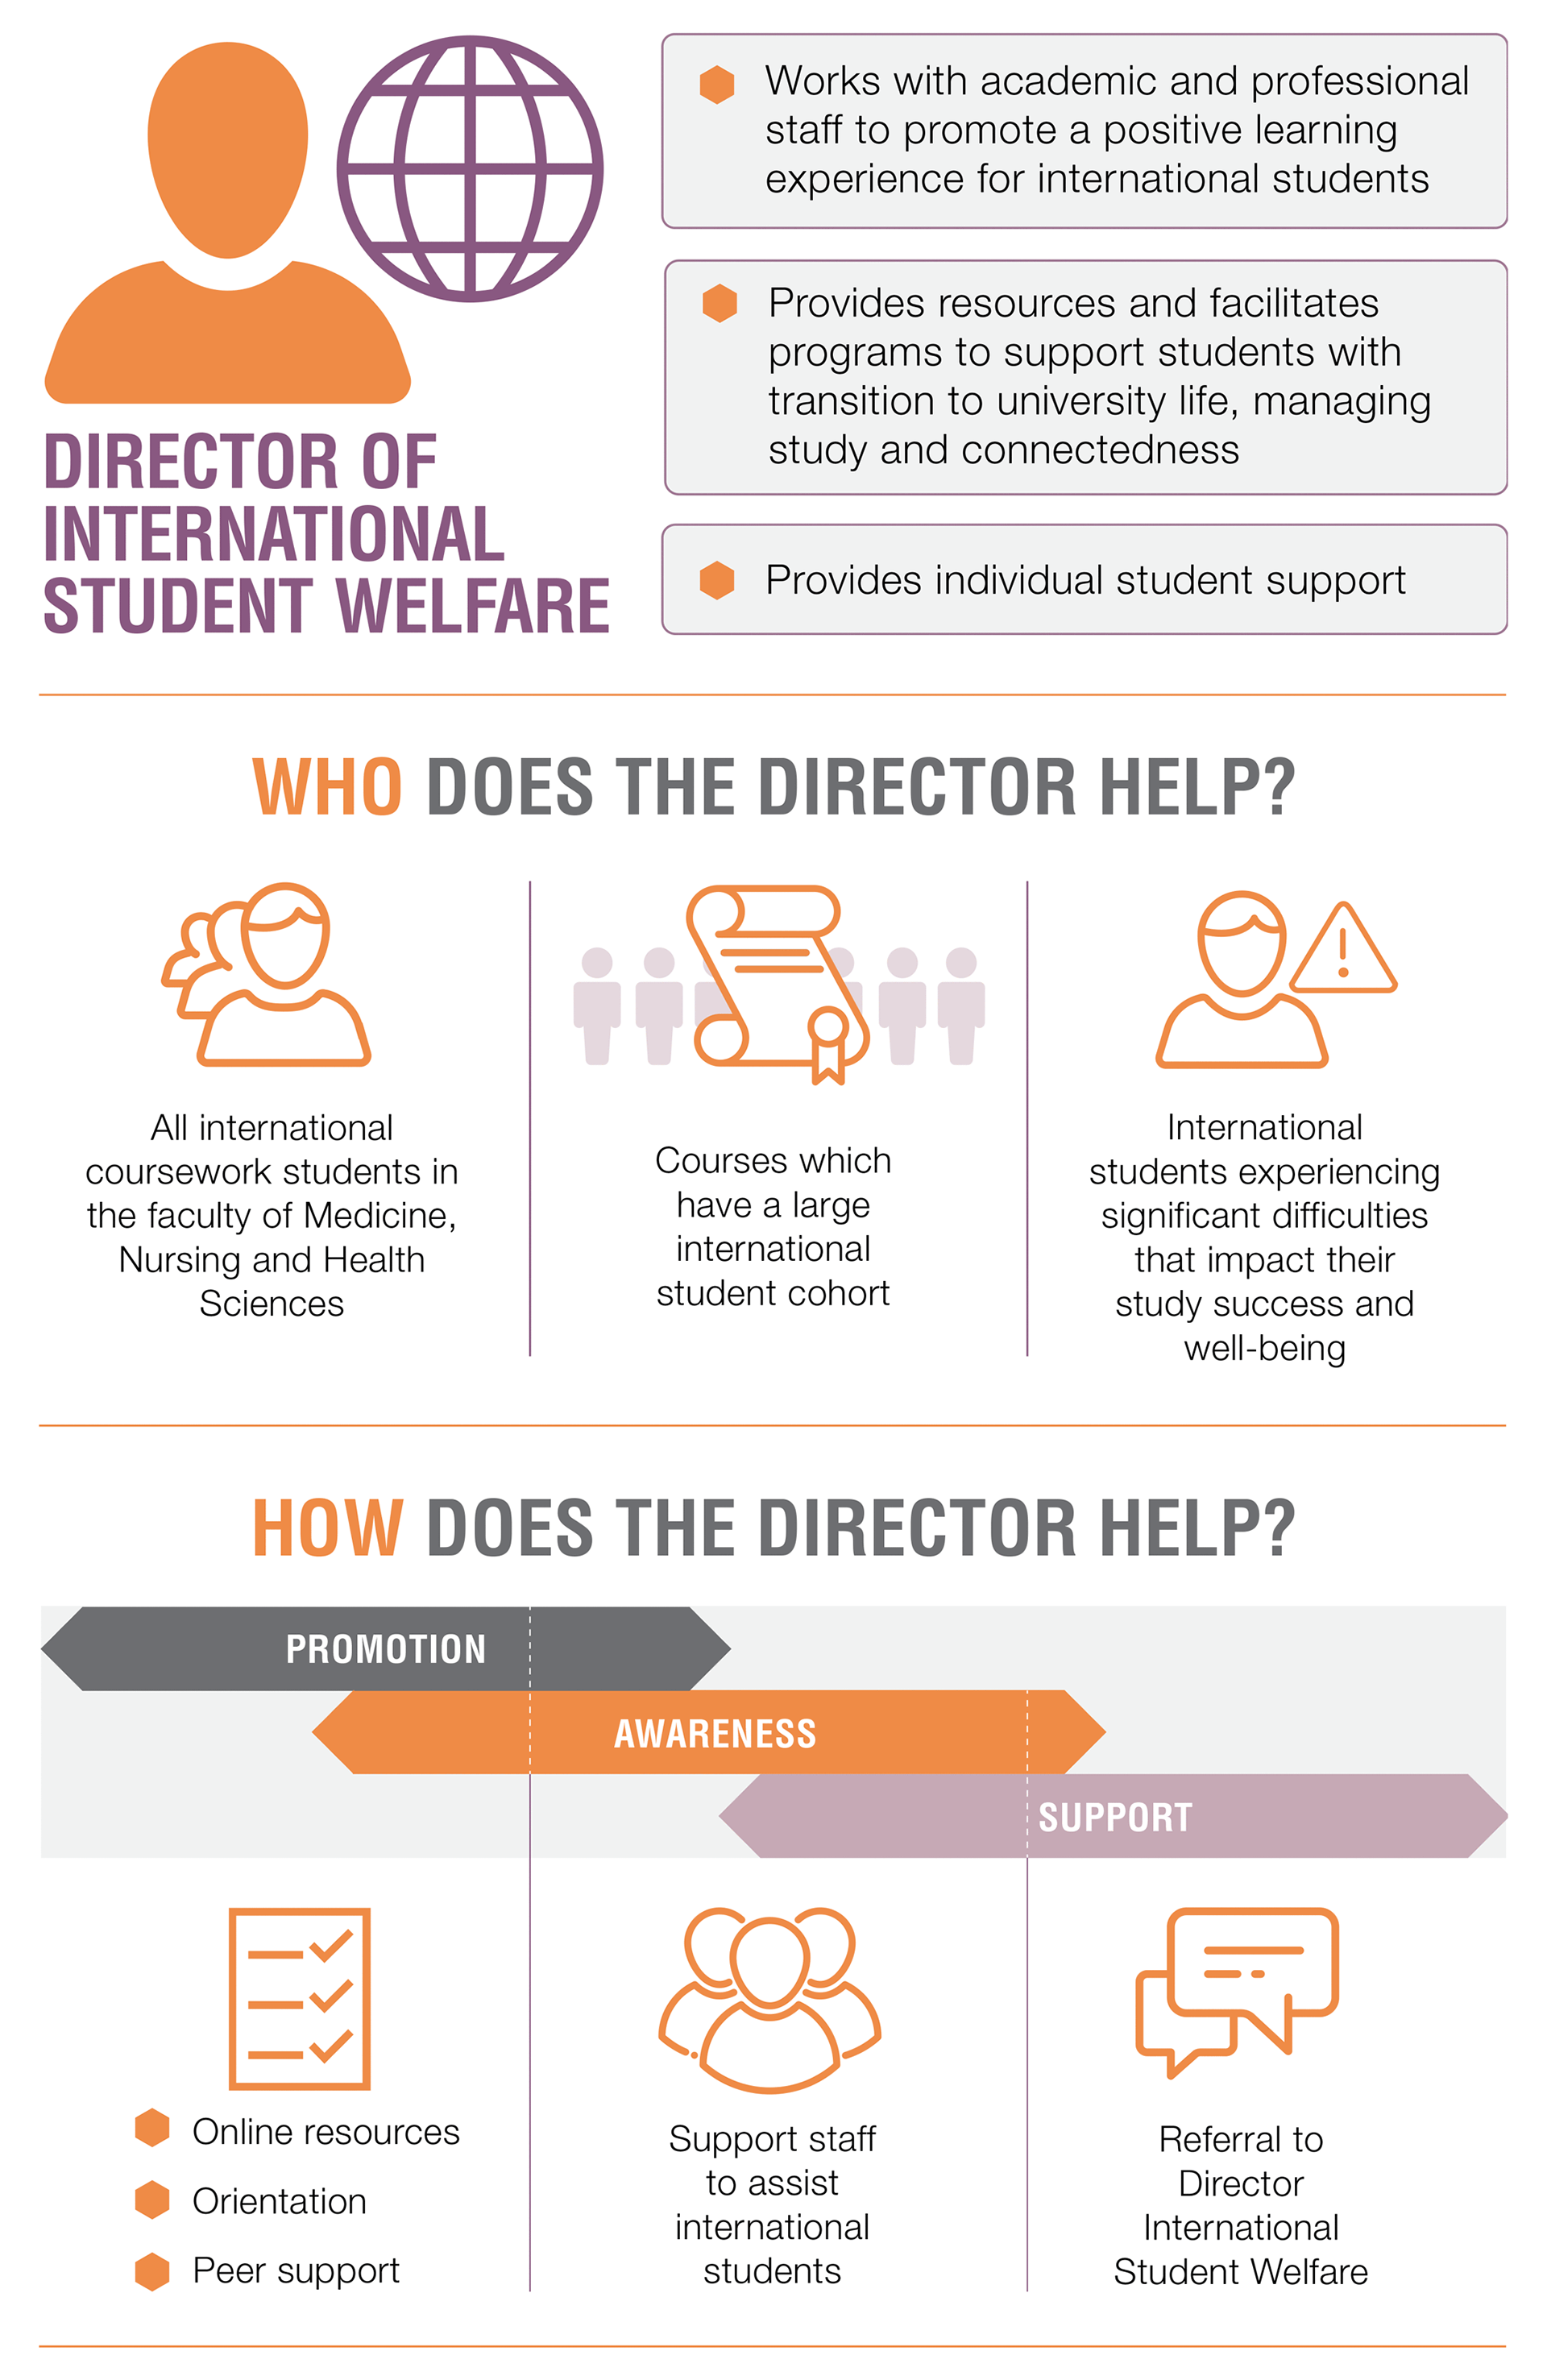
Infographic summarising the role of the Director of International Student Welfare at Monash University.
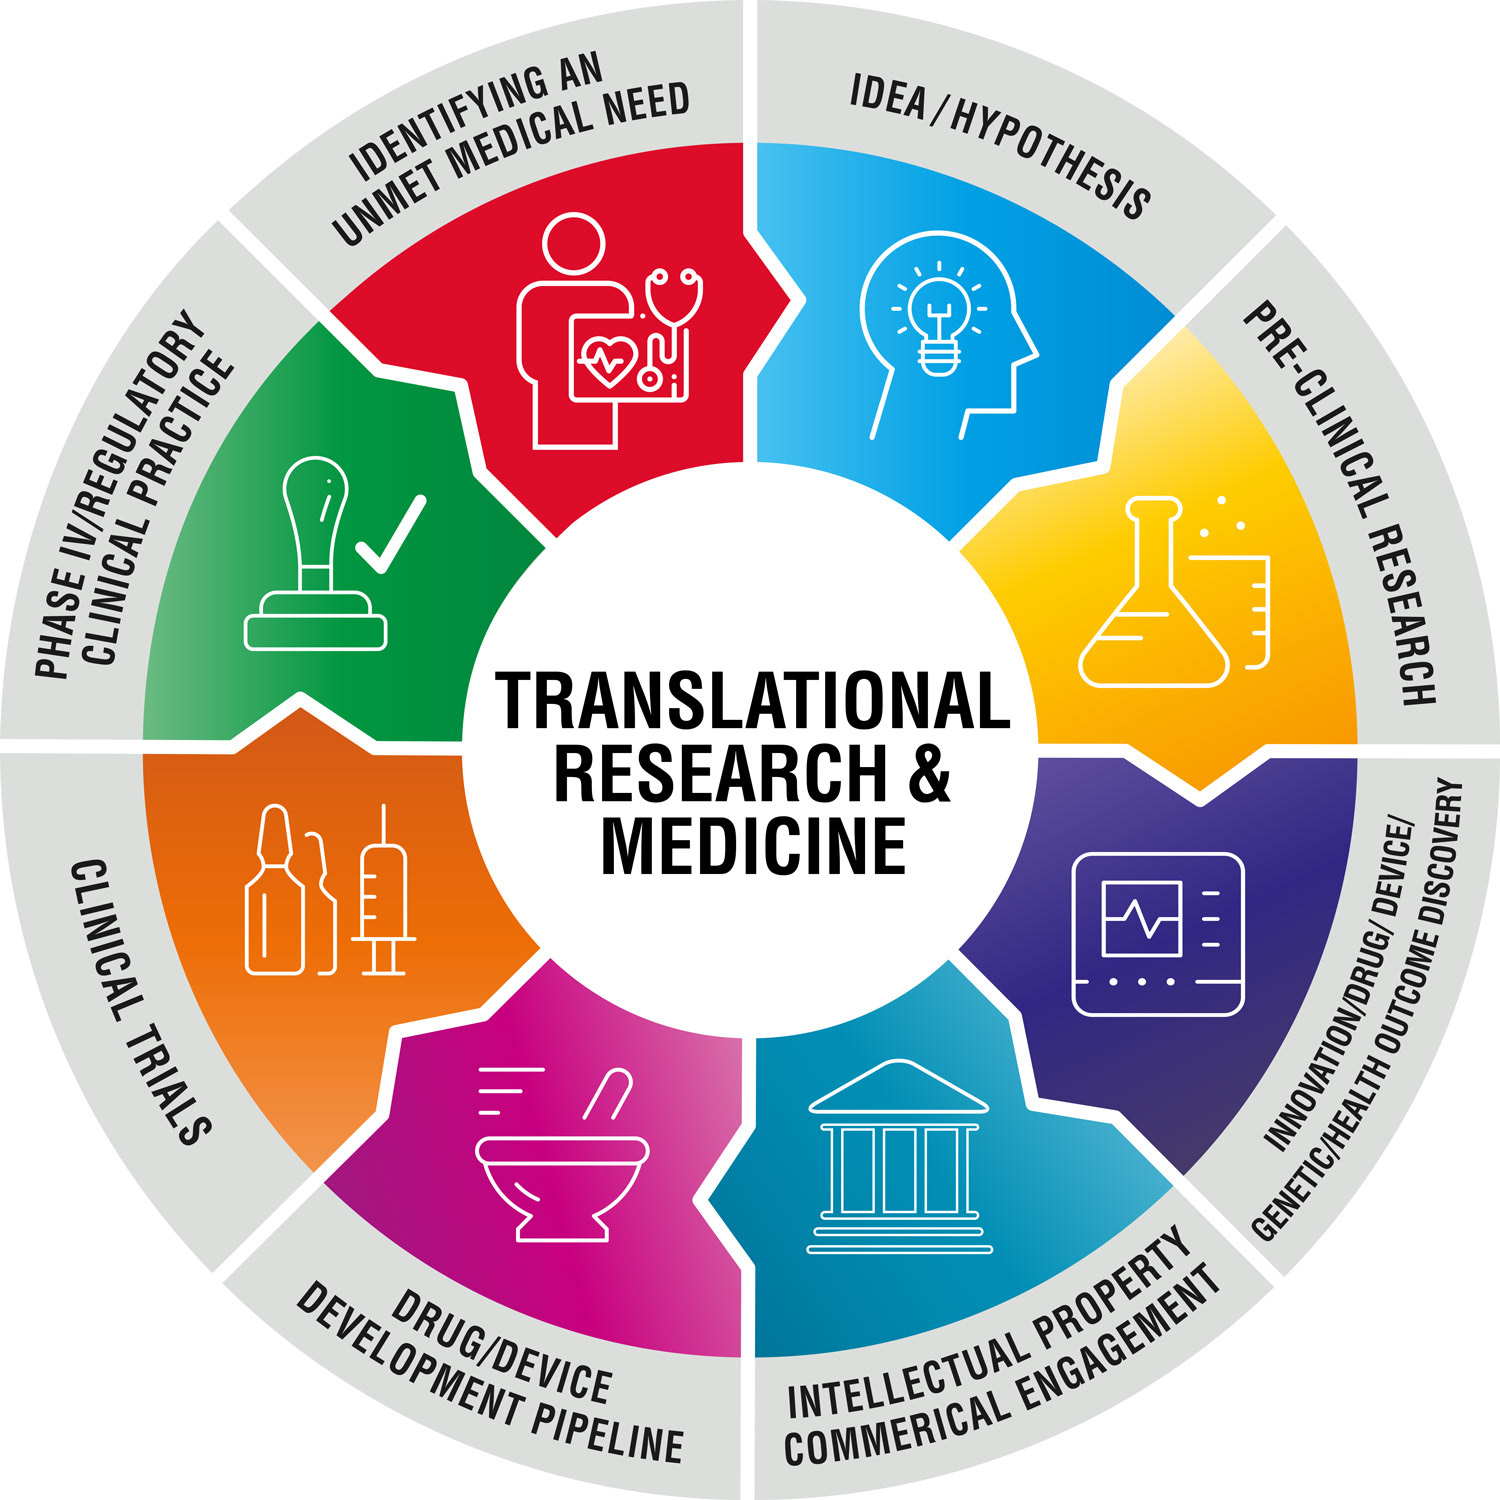
Chart illustrating the Translational Research and Medicine lifecycle.
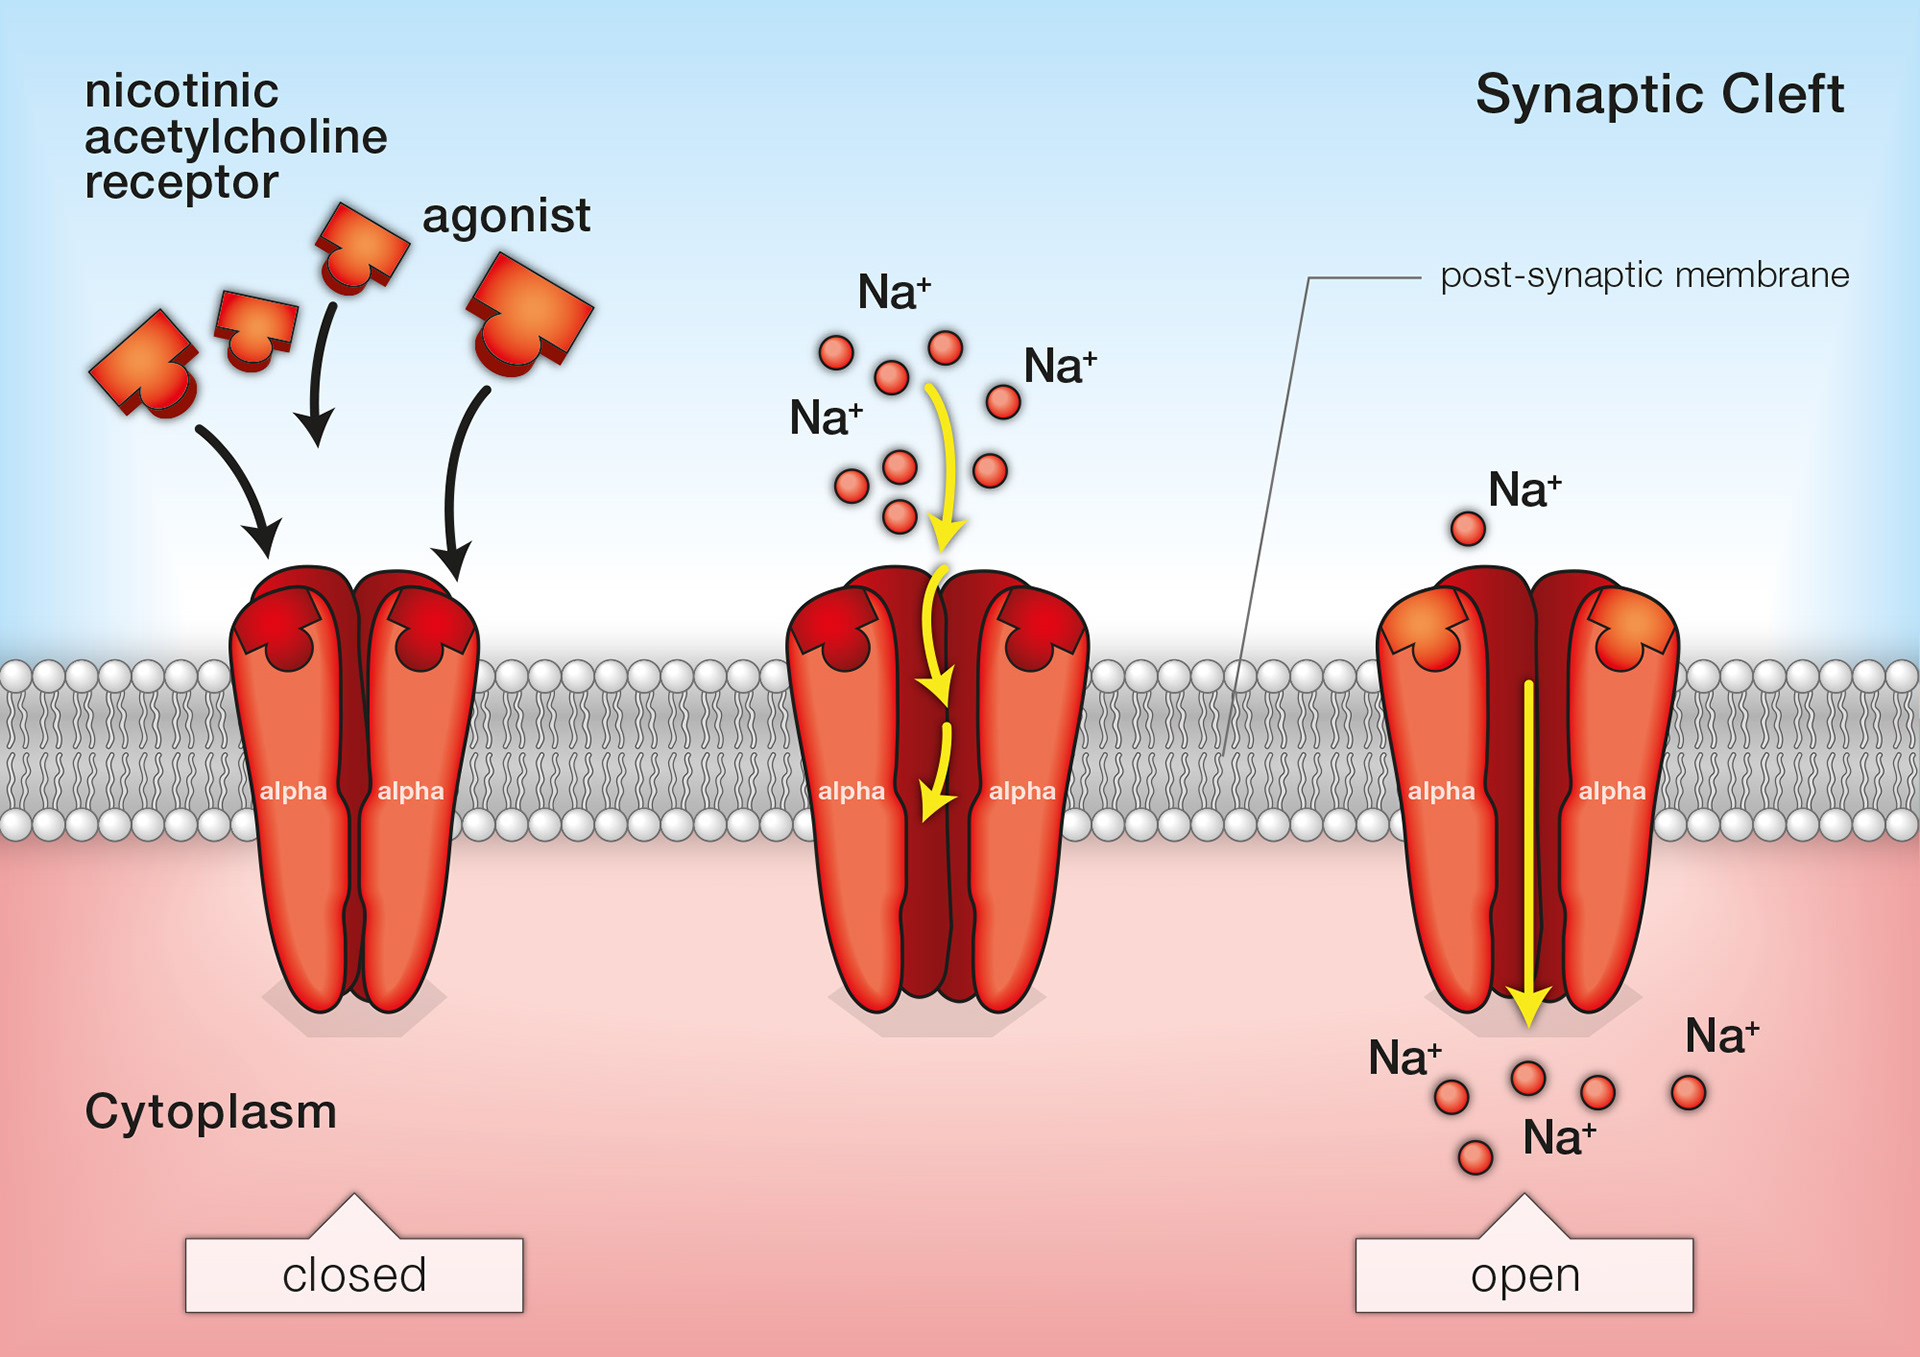
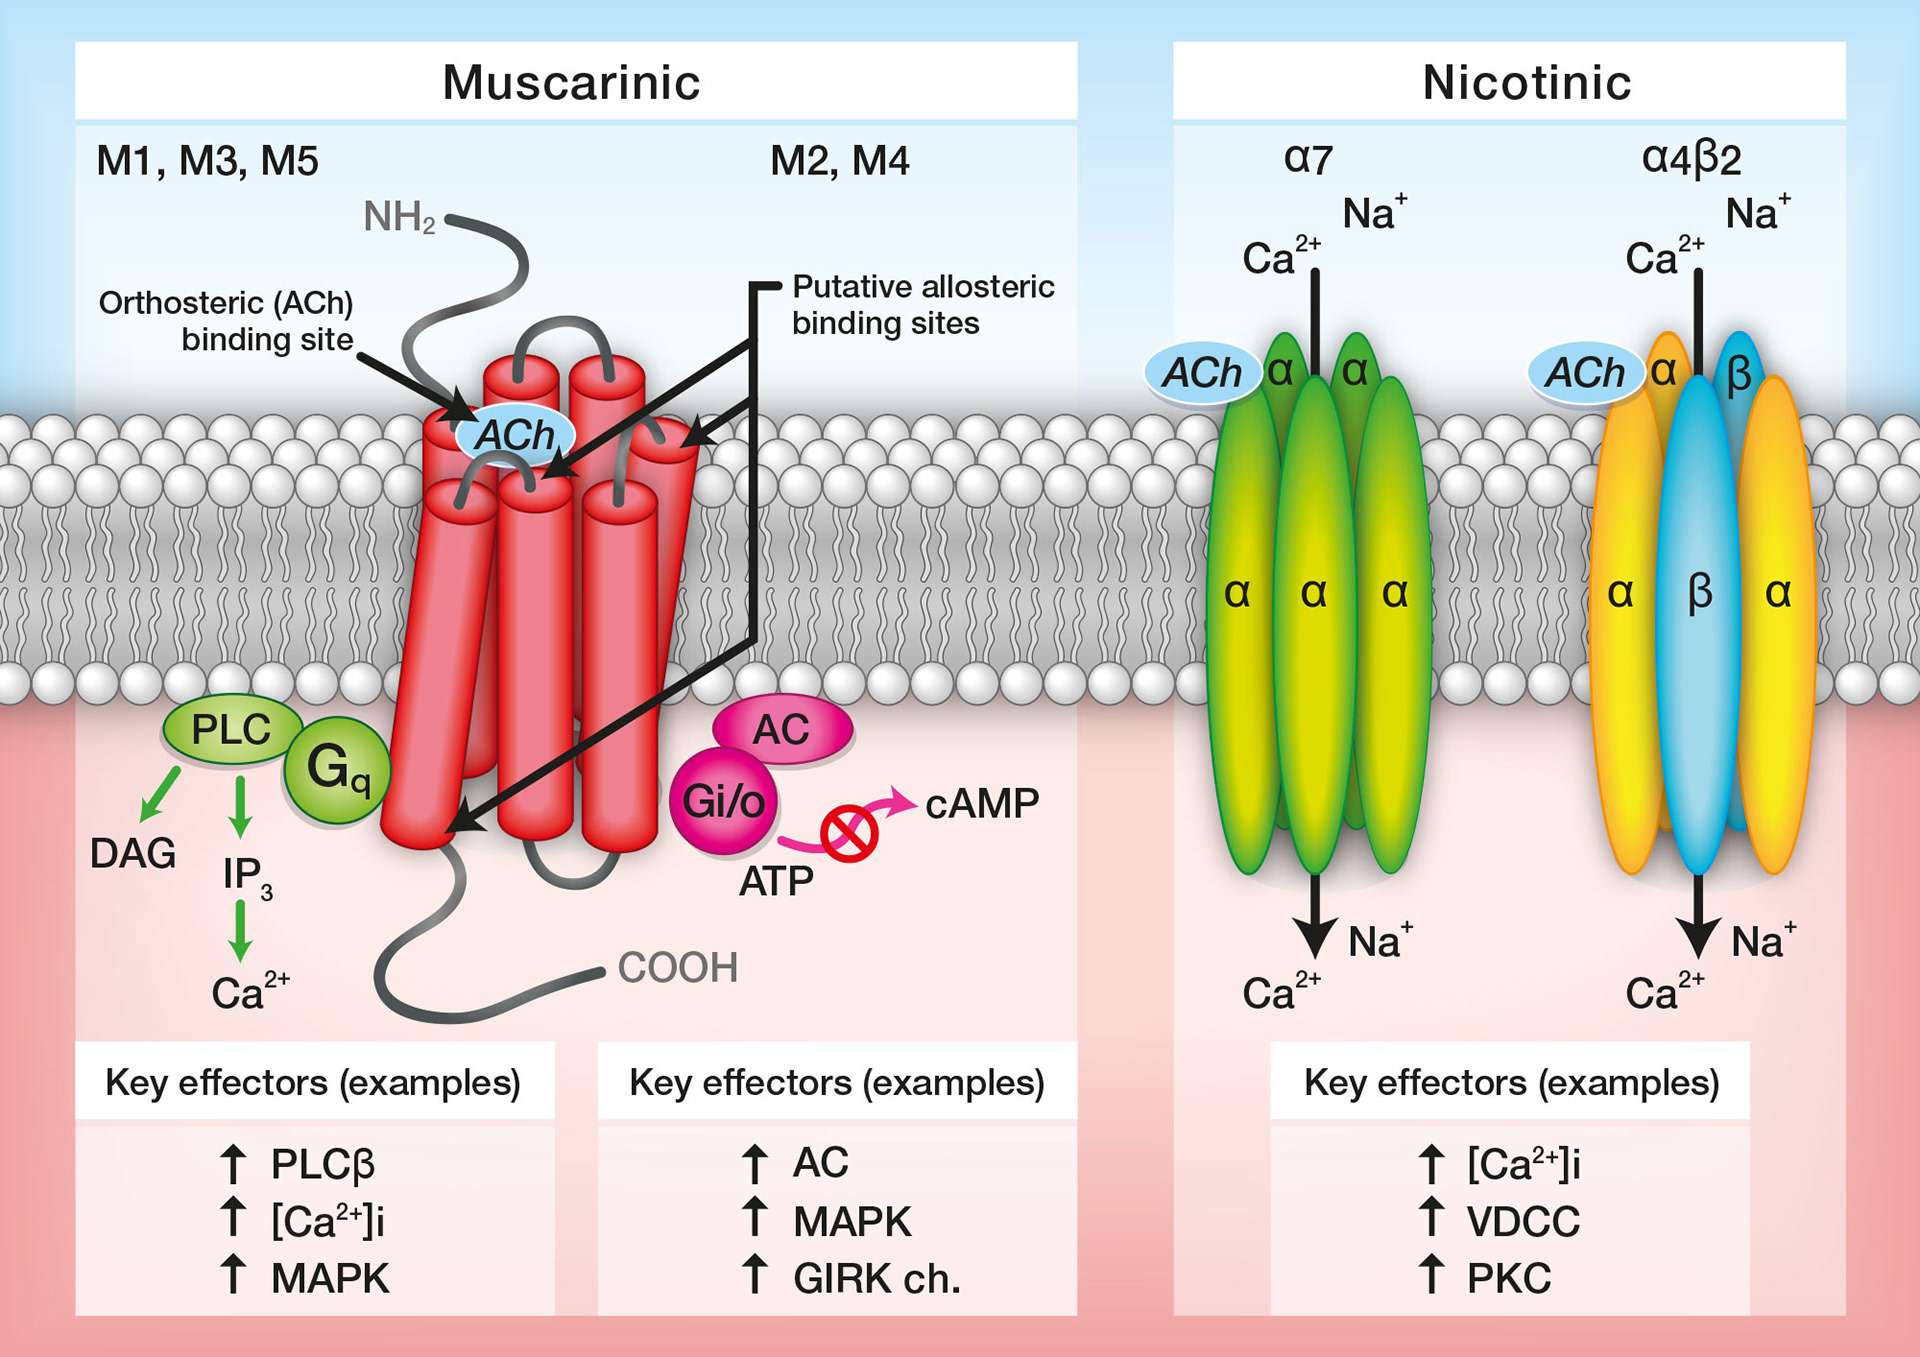
A selection of illustrations produced for use in online learning materials.


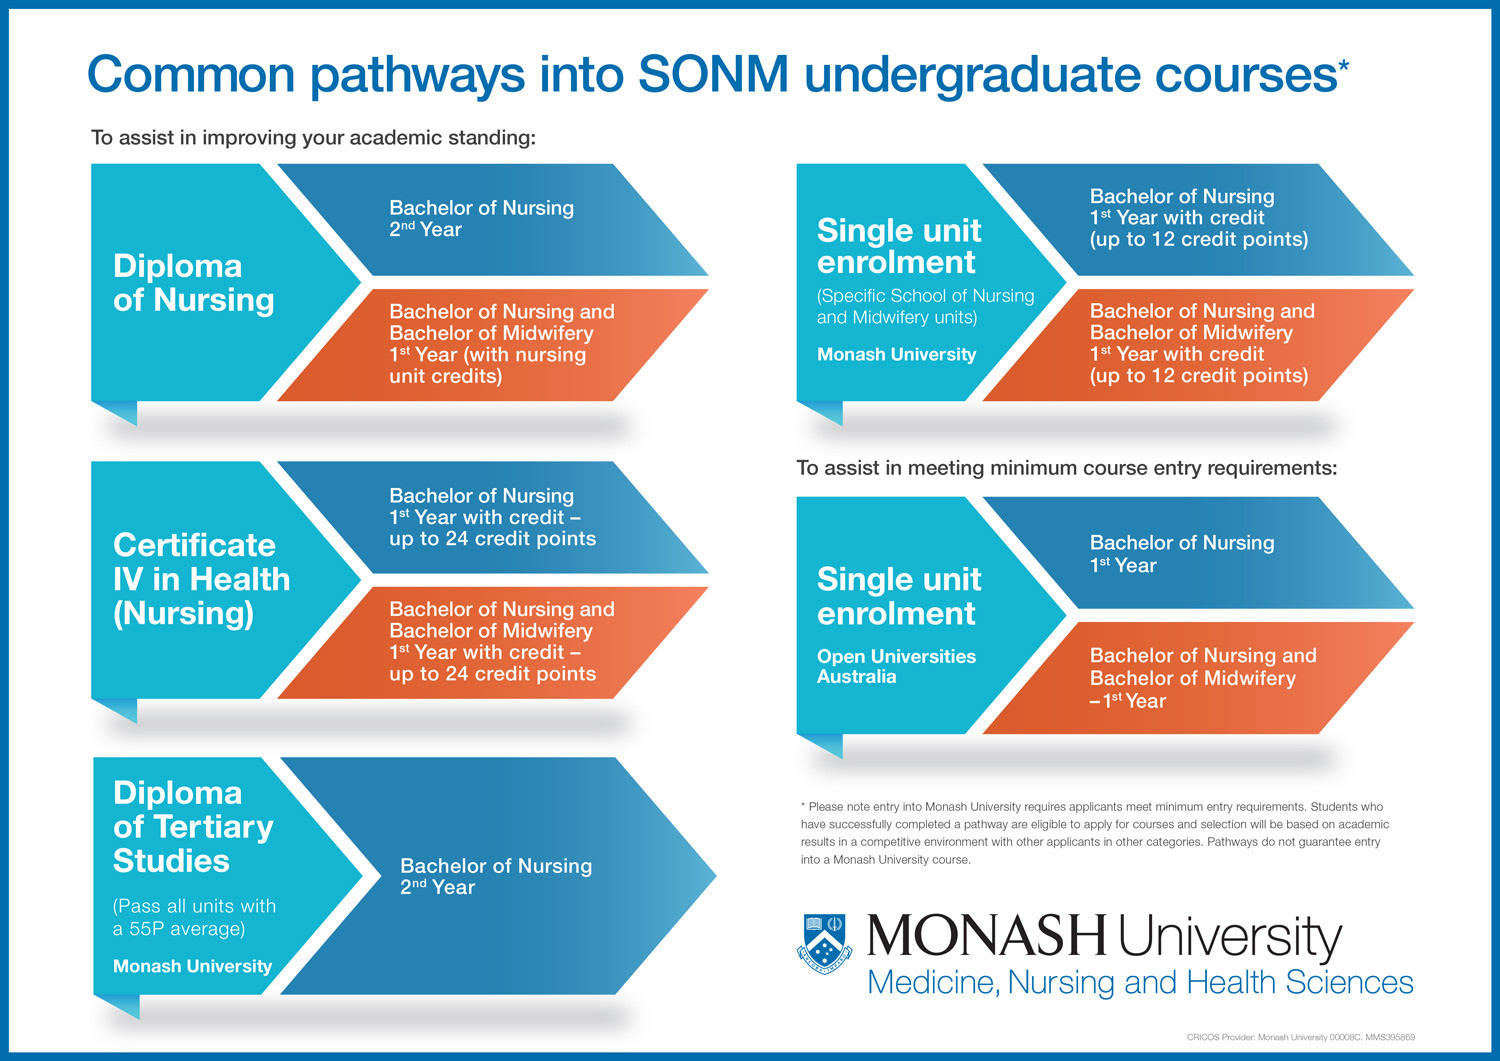
An infographic design created for use in a powerpoint presentation as part of the rollout of a program for nursing professionals.
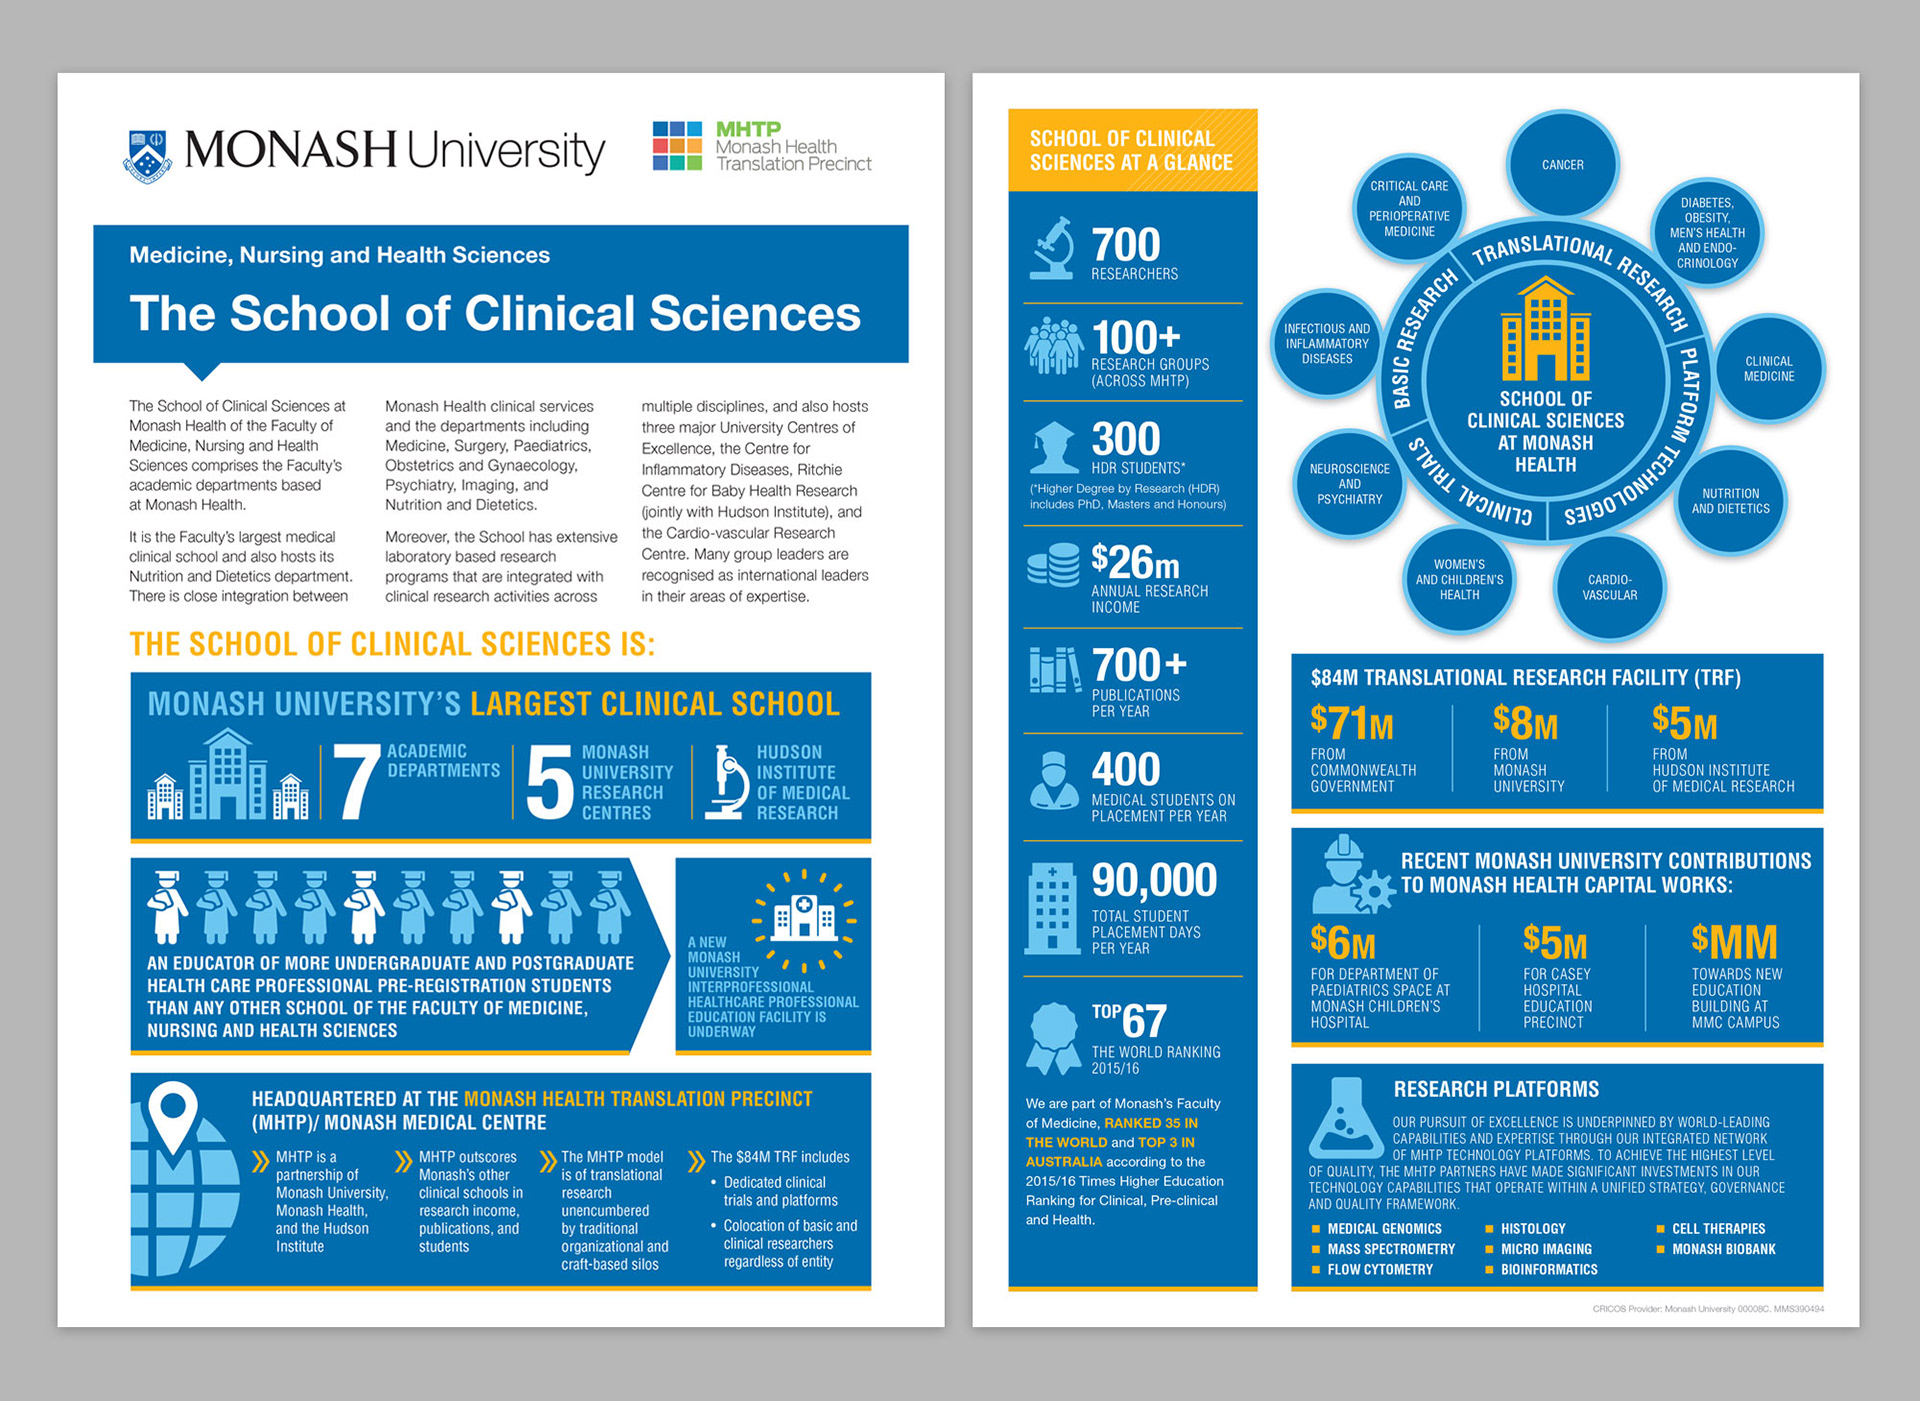
A 2 page infographics-heavy flyer summarising the School of Clinical Sciences.